3. Configure Power BI
By now, we have all the datasets that we need to start developing our Power BI report.
Step 1. Open the Power BI file
In the GitHub repository that you downloaded, there's a Power BI file, Lead Service Line Map - minimal.pbix. Go ahead and open it and navigate around if you want to get some familiarity. You don't need any prior Power BI knowledge for this tutorial.
Step 2. Change data sources
Now we need to edit the sources of two of our datasets factLSL.csv and dimLSLType.csv to point to our spreadsheets.
For each of these tables, do the following -
- Navigate to the
Tableicon in the left sidebar - Click on the table name from the right -
factLSL.csvordimLSLType.csv - Select the three dots, followed by
Edit query. - In the new window that pops up, go the right sidebar and select the settings wheel icon next to Source.
- Browse to select the relevant spreadsheet.
- Click
Transform and saveon the top left menu bar.
Step 3. Change GeoJSON data URL
- First of all, upload the downloaded GeoJSON file to a web server. The best place to upload this file is to your GitHub repository.
- Copy the URL. If you uploaded the file to GitHub, the URL will look something like this
https://raw.githubusercontent.com/kedar-ketos/lead-service-line-map/4ebab02d7f6eb1726c4d6e69872df1f74c273488/Data/Boundaries%20-%20Neighborhoods.geojson. - Navigate to the
Lead Service Linetab in Power BI. - Click anywhere on the map visual, select the
Formatbrush icon on the right under theVisualizationstoolbar. - Go down to
GeoJSONand paste the URL here.
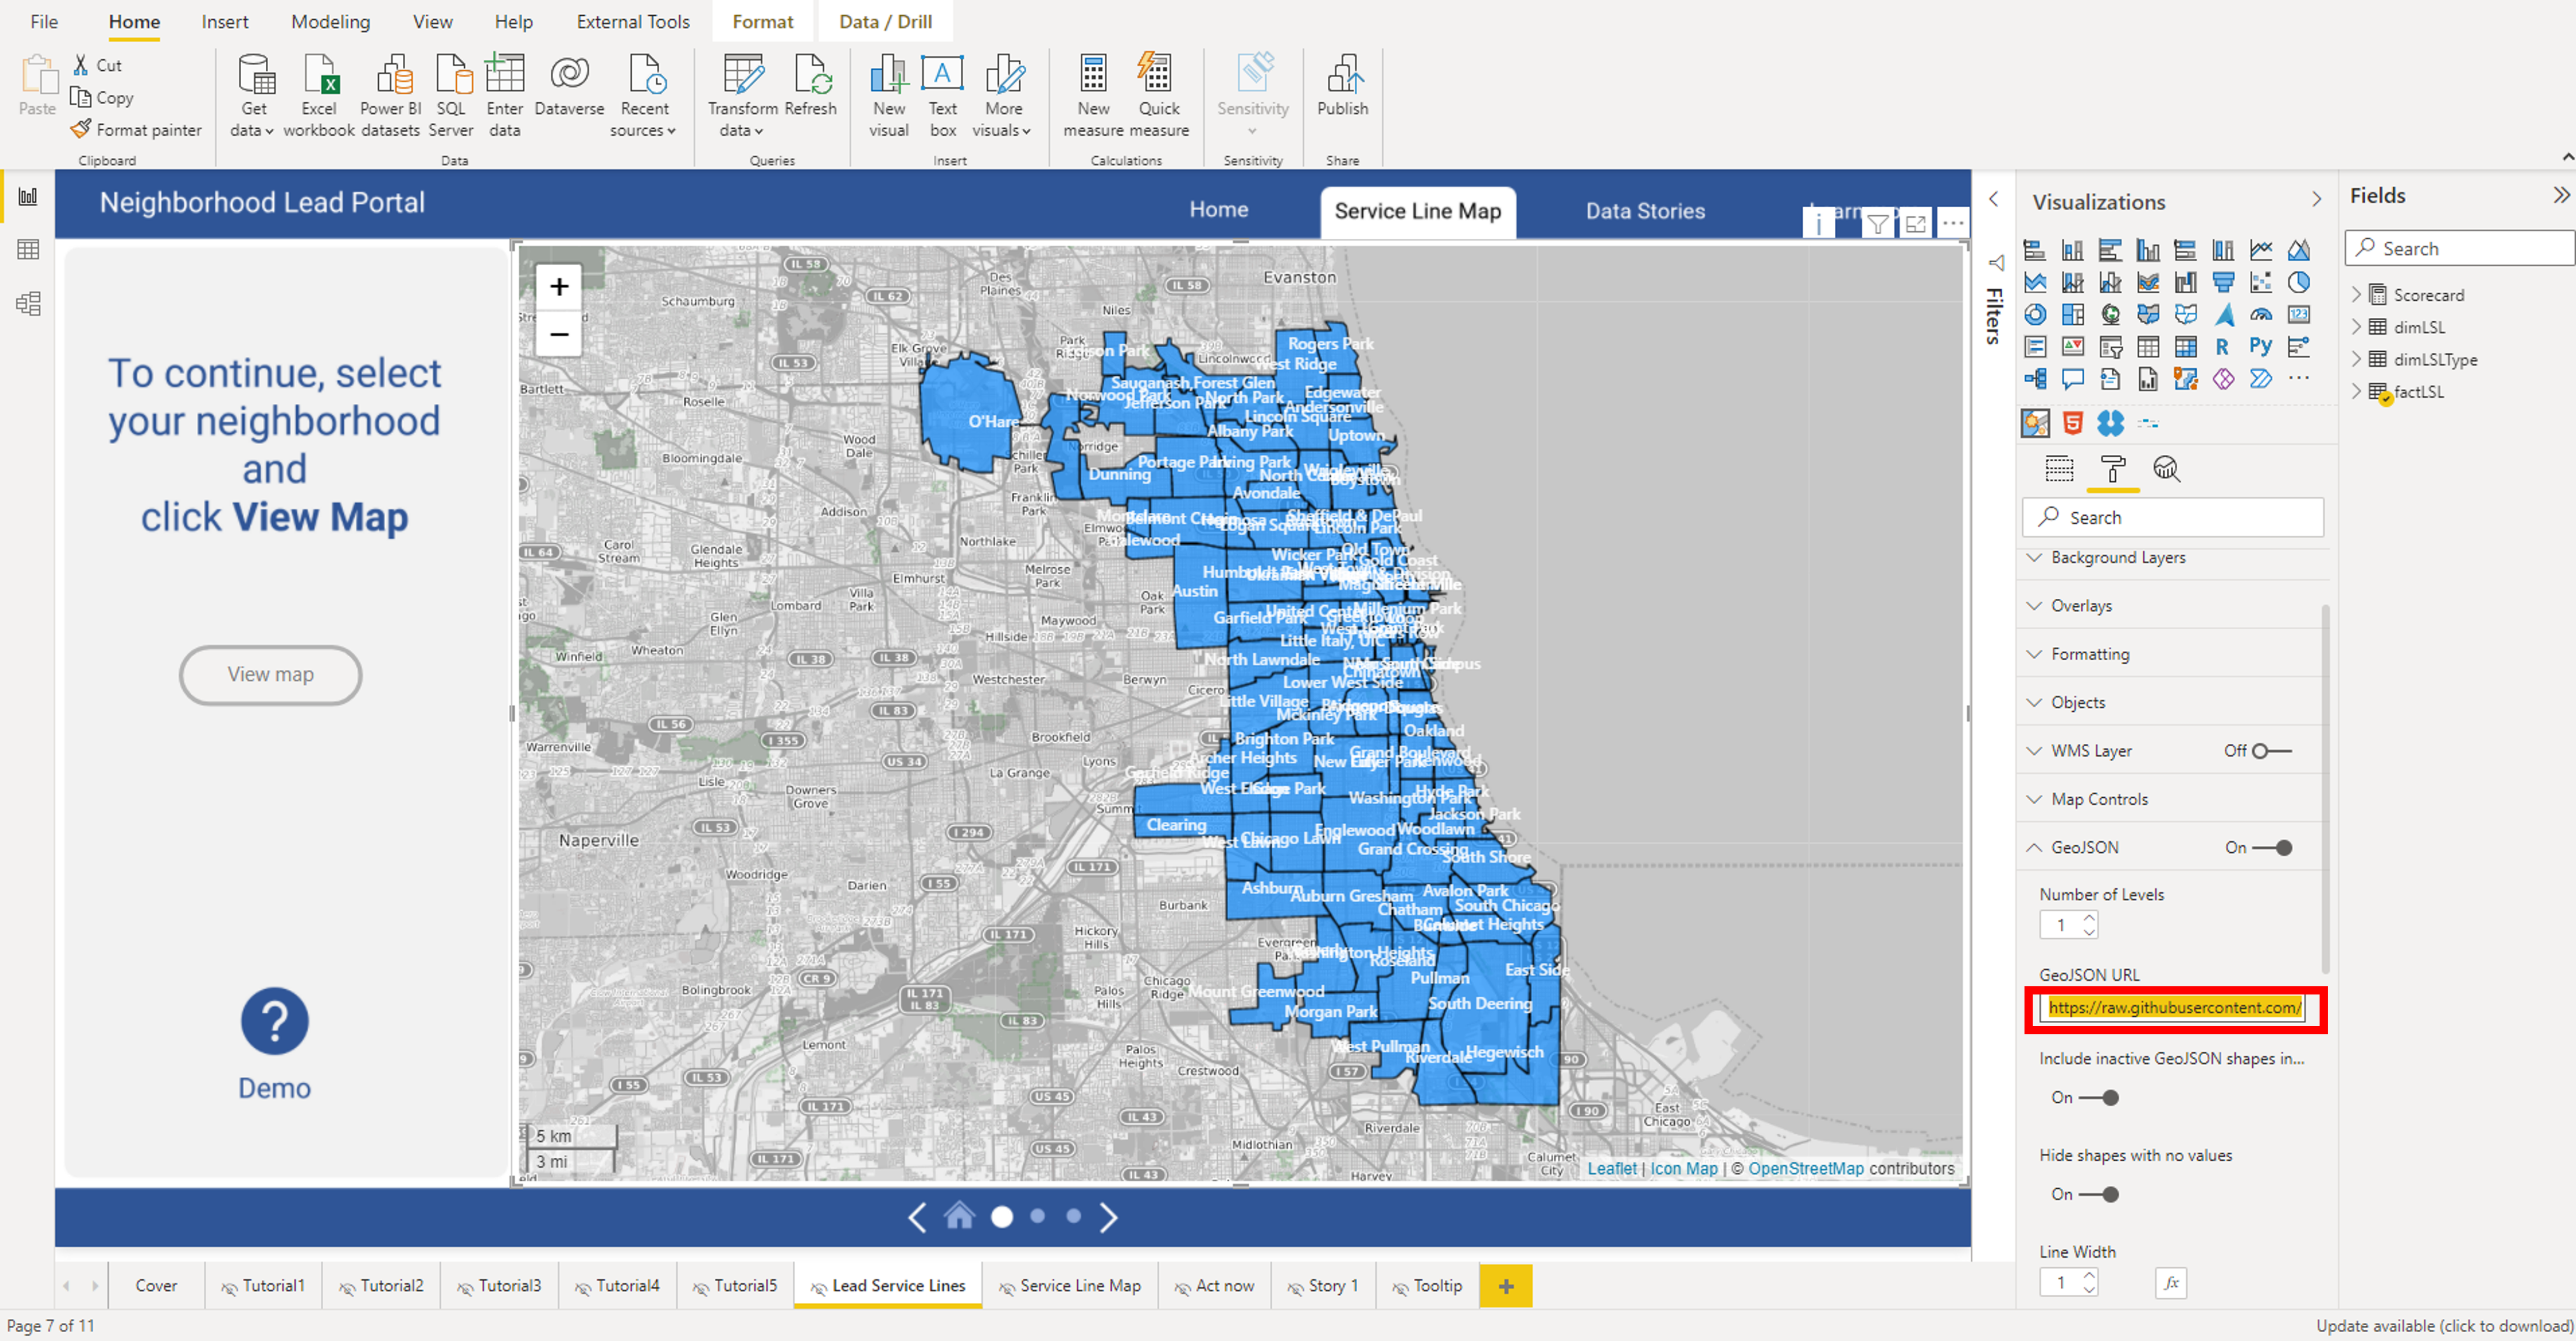
Navigate around the Power BI report to verify if everything works as expected.
Summary
With these three easy steps, we have now connected the available datasets to Power BI. Next, we will see how to share our Power BI with everyone.