1. Overview & features
The report application that we generated using the approach outlined in this documentation has been hosted here.
Note that if you followed the tutorial exactly as discussed under the tutorial section, then you will be able to build a shorter version of the deployed demo. That's because when making the demo application, we extended the principles of our approach to include additional datasets. That allowed us to generate additional stories for the demo.
We discuss some of those data sources as well as the features of this approach in this document.
Feature 1. The data model
Developing a dimensional data model gives us the flexibility to easily replace any dataset while maintaining its relationships with other datasets in the model. As a result of this, we can maintain datasets completely independent of our visualizations and also refresh our datasets using any tool at our disposal - programming languages, APIs, or even local spreadsheets.
The data model that we used for this demo application is showed in the image below. As you can see, we have also included data from SDWA violations to show additional insights.
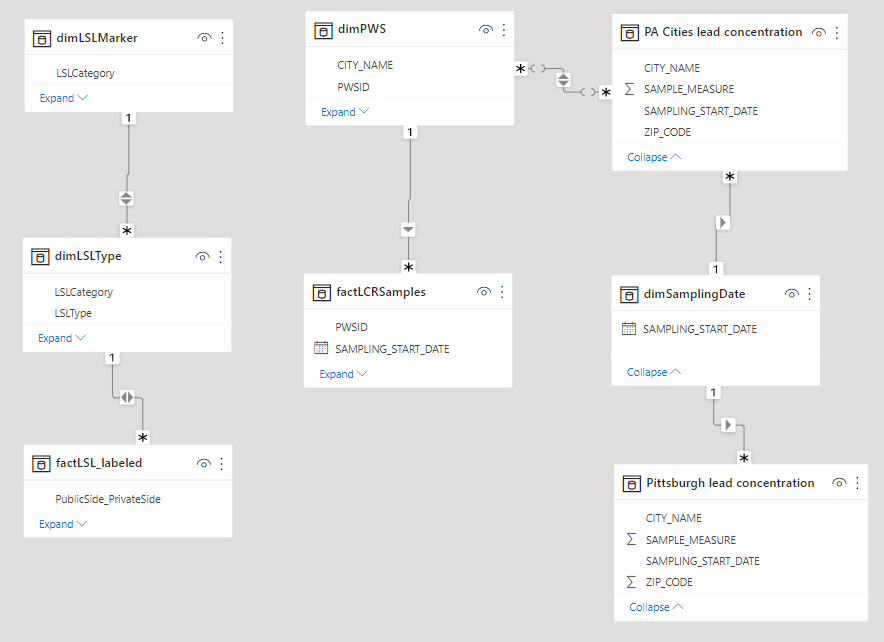
Note
Notice how easily we can swap out one table with another one without affecting the other datasets. This is very convenient if the other datasets are large in size. Also, we can easily swap Pittsburgh data for, say, Chicago, as in the tutorial.
Feature 2. Share information in stages
We observed that one of the challenges in reading the existing mapping solutions for lead service lines is that they overwhelm the user with a lot of information all at once. We tried to solve this by sharing the most relevant information first and then allowing users to dive deeper, if they wish to.
Feature 3. User-friendly work-flow
We have added animated guides, tutorials, and user-friendly illustrations of service lines wherever required. In addition to that, our insights encourage viewers to engage by asking them questions and interacting with the visuals.
Feature 4. Higher engagement with data
Our solution allows users to download all the data that goes into making any visual by selecting the download option at the top right-hand corner of the graphic.